
Signal Analog Segments
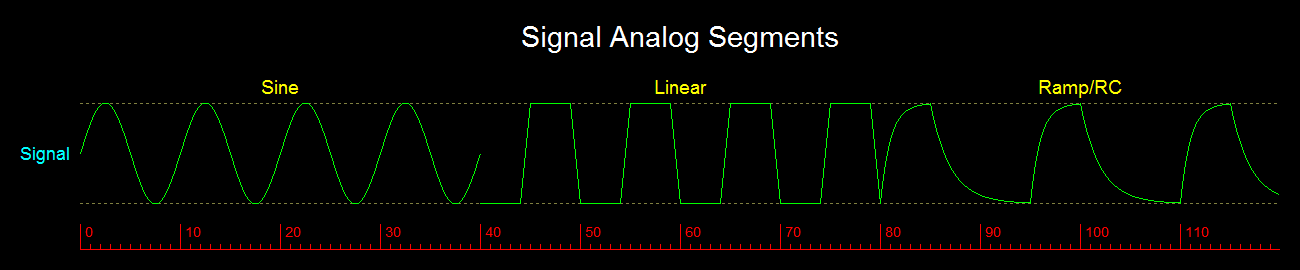
An analog segment in a Signal waveform can be one of three types: Sine, Linear or Ramp/RC.
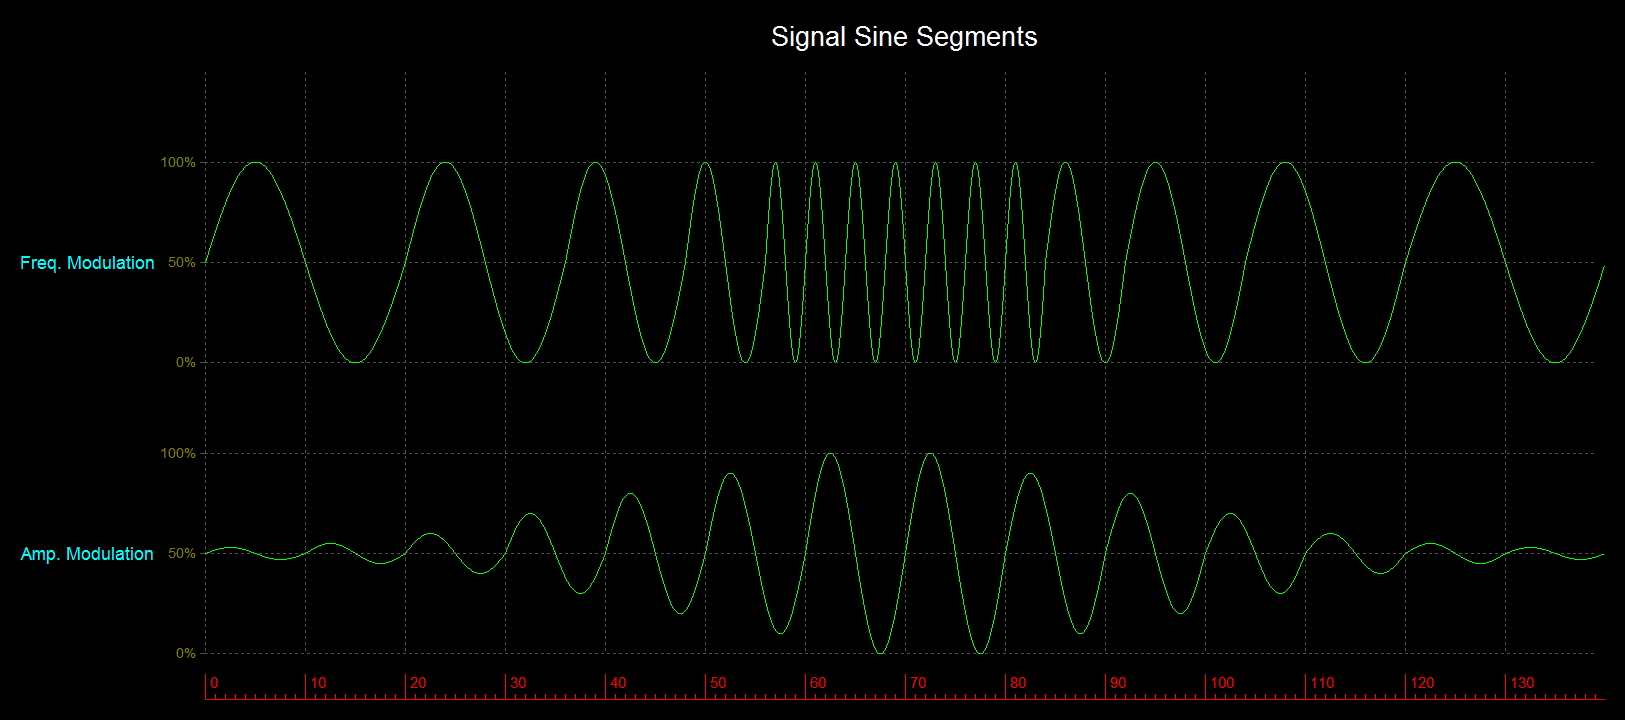
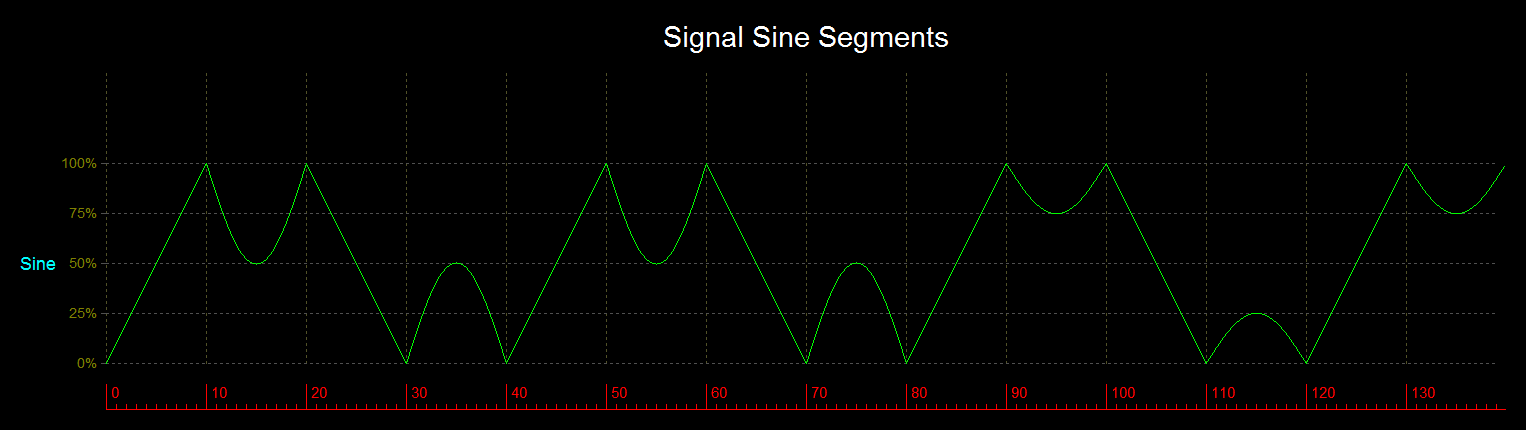
- Sine is a sinusoid waveform, based on the equation: y(x) = Amplitude * sin(x)
- Linear is a waveform, that is made of 4 connected linear lines.
These lines correspond to Low level, Low-to-High transition, High level, and High-to-Low transition, similar to how Auto-signal is constructed.
Unlike their digital segment counterparts - where Low level is always drawn at the bottom of the waveform region, and High level is always drawn at the top of that region - analog Low and High levels can be drawn anywhere within the waveform region.
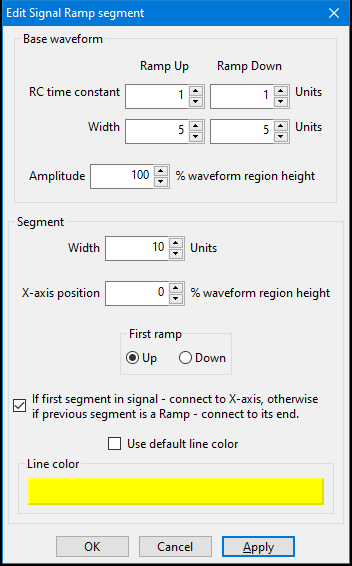
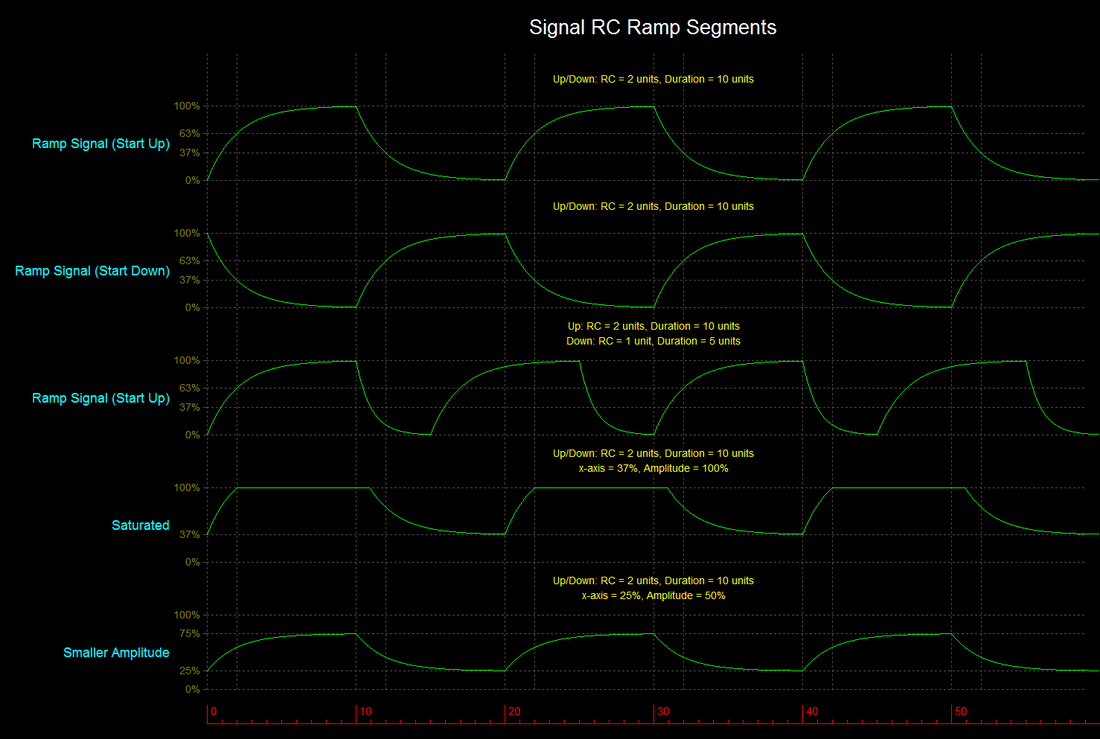
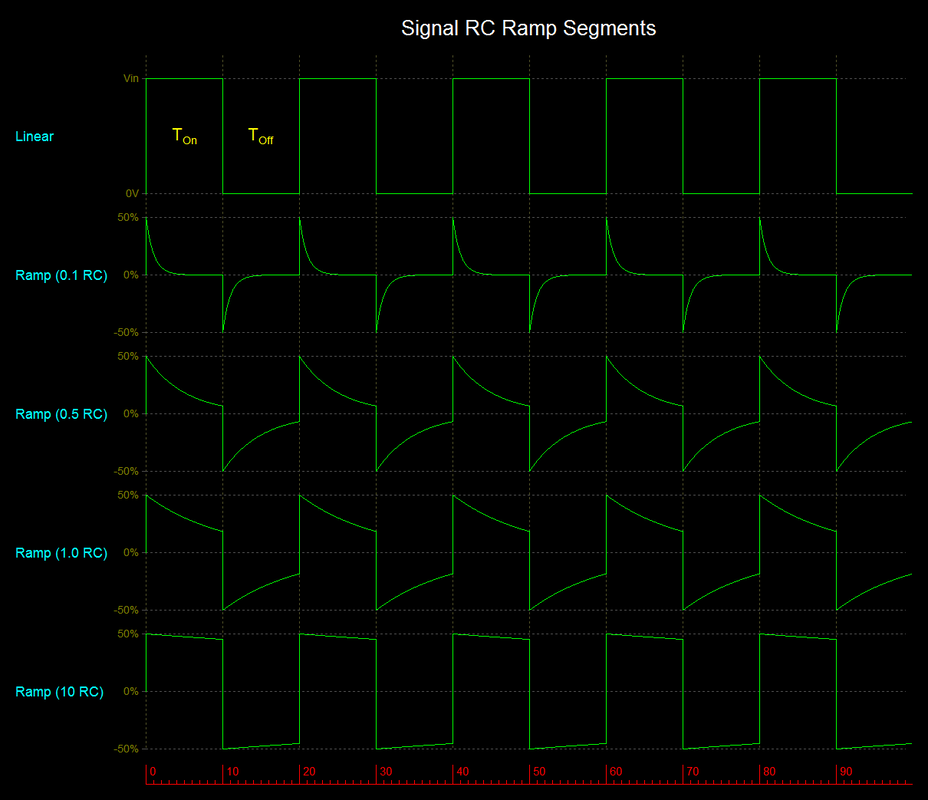
- Ramp is an RC time constant waveform, based on the following equations:
Up ramp: y(x) = Amplitude * (1 - e**(-x/RC))
Down ramp: y(x) = Amplitude * e**(-x/RC))
For each of these segment types, you define the Base waveform, and then describe how it is to be drawn across the width of the entire segment. Therefore, it's possible for a segment to show just a portion of the base waveform, or multiple lengths of it.
Each Base waveform is defined relative to the X-axis (y=0). Upon drawing the segment, you select the position of the X-axis within the waveform region. This lets you vertically shift the waveform within the waveform region.
Both waveform Amplitude and X-axis position are defined relative to the waveform region height, as a percentage of that height, with a resolution of 1%.
X-axis position definition: 0% is the bottom of the waveform region, 100% is the top, -100% is full height below the bottom (only possible with Ramp/RC type).
Amplitude definition: 100% is the full height of the waveform region, whereas 50% is half that height.
Note: Unlike when digital segments meet, when a digital and an analog segment meet, or two analog segments meet, they do not automatically form a contiguous line.
Initial value for
- Line color is the D value line color,
which comes from the Waveform options dialog
(Diagram | Waveform options).
If you check the "Use default line color" box, line color will be affected by any change made to it in the
Waveform options dialog. This allows you to define the looks of multiple segments across the entire diagram. Otherwise, uncheck the box to individually customize the line color of this segment.
There is no label associated with an analog segment, unlike with a digital segment.
- Sine is a sinusoid waveform, based on the equation: y(x) = Amplitude * sin(x)
- Linear is a waveform, that is made of 4 connected linear lines.
These lines correspond to Low level, Low-to-High transition, High level, and High-to-Low transition, similar to how Auto-signal is constructed.
Unlike their digital segment counterparts - where Low level is always drawn at the bottom of the waveform region, and High level is always drawn at the top of that region - analog Low and High levels can be drawn anywhere within the waveform region.
- Ramp is an RC time constant waveform, based on the following equations:
Up ramp: y(x) = Amplitude * (1 - e**(-x/RC))
Down ramp: y(x) = Amplitude * e**(-x/RC))
For each of these segment types, you define the Base waveform, and then describe how it is to be drawn across the width of the entire segment. Therefore, it's possible for a segment to show just a portion of the base waveform, or multiple lengths of it.
Each Base waveform is defined relative to the X-axis (y=0). Upon drawing the segment, you select the position of the X-axis within the waveform region. This lets you vertically shift the waveform within the waveform region.
Both waveform Amplitude and X-axis position are defined relative to the waveform region height, as a percentage of that height, with a resolution of 1%.
X-axis position definition: 0% is the bottom of the waveform region, 100% is the top, -100% is full height below the bottom (only possible with Ramp/RC type).
Amplitude definition: 100% is the full height of the waveform region, whereas 50% is half that height.
Note: Unlike when digital segments meet, when a digital and an analog segment meet, or two analog segments meet, they do not automatically form a contiguous line.
Initial value for
- Line color is the D value line color,
which comes from the Waveform options dialog
(Diagram | Waveform options).
If you check the "Use default line color" box, line color will be affected by any change made to it in the
Waveform options dialog. This allows you to define the looks of multiple segments across the entire diagram. Otherwise, uncheck the box to individually customize the line color of this segment.
There is no label associated with an analog segment, unlike with a digital segment.
Sine Segment
|
Add a new Sine segment to a Signal waveform
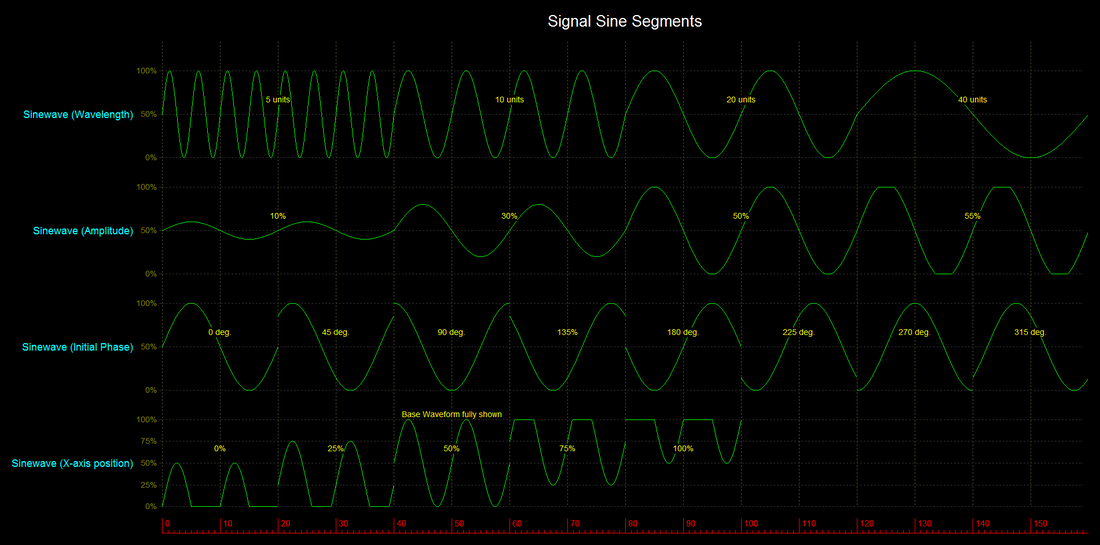
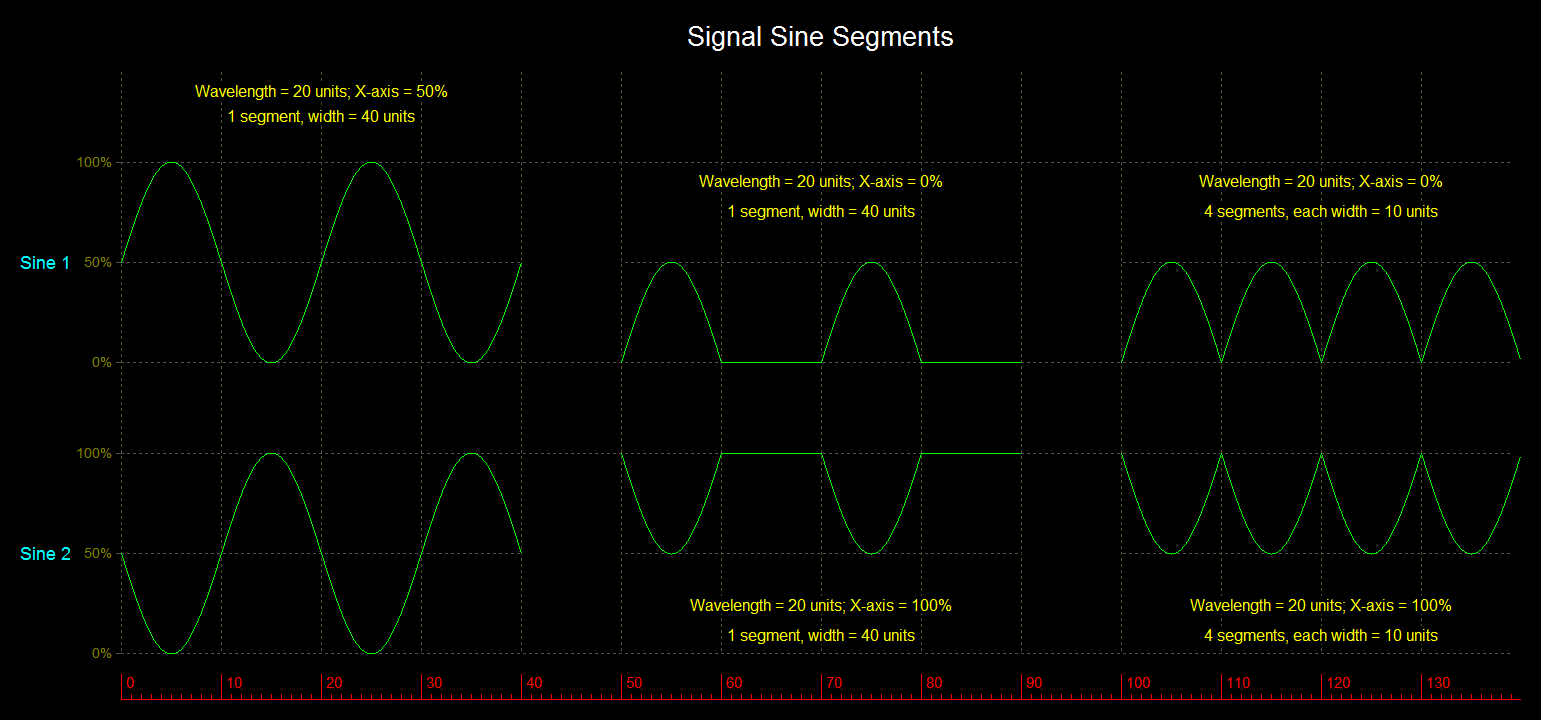
Menu: Segment | 1 Shortcut: 1 Base Waveform A Sine base waveform is defined by its wavelength and amplitude. It's vertically symmetrical across the X-axis. Segment Drawing within a segment is defined by: - Width in drawing units, - X-axis position within the waveform region, - Initial Sine wave phase (0-359 degrees). Waveform saturation will occur when drawing values beyond the waveform region height. |
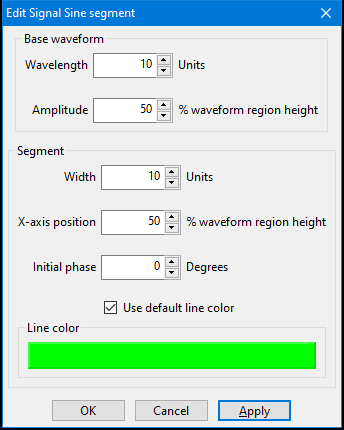
Edit Signal Sine segment dialog
|
|
|
|
|
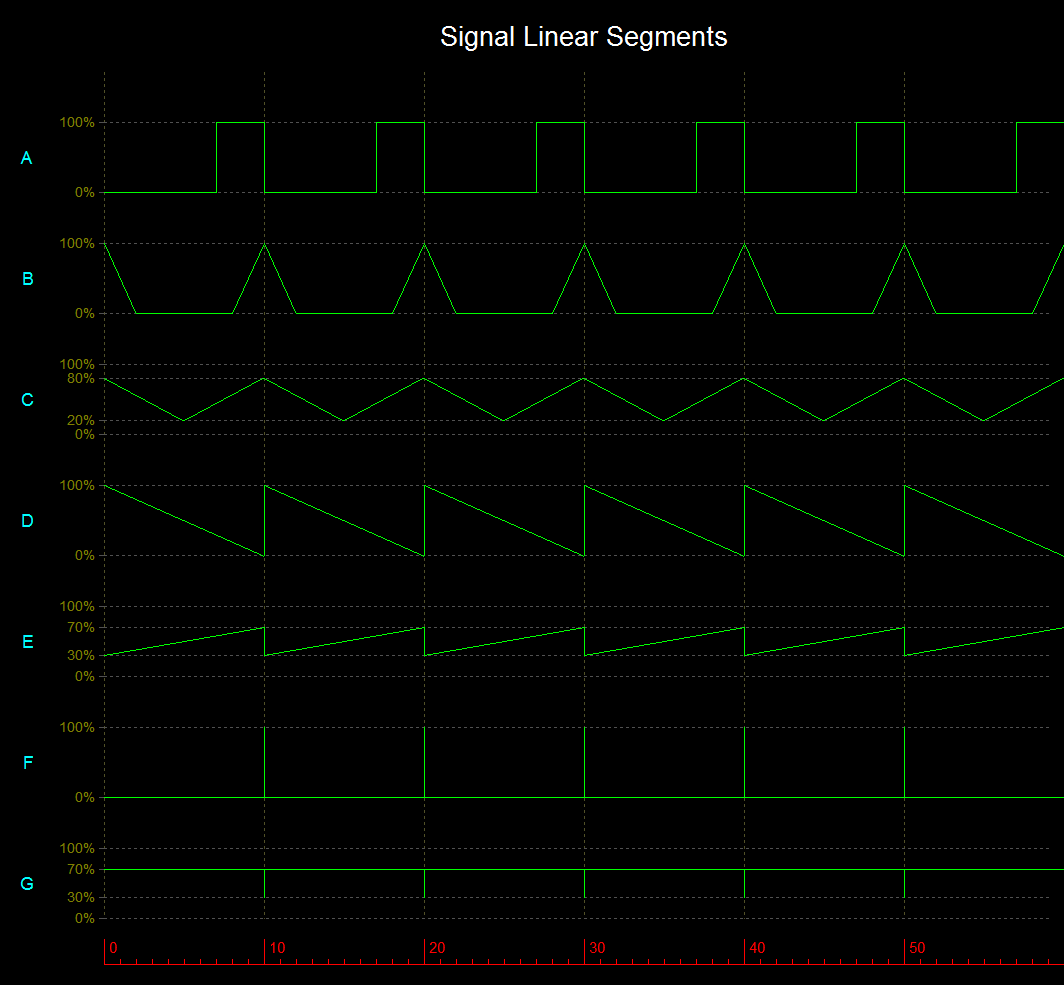
Linear Segment
|
Add a new Linear segment to a Signal waveform
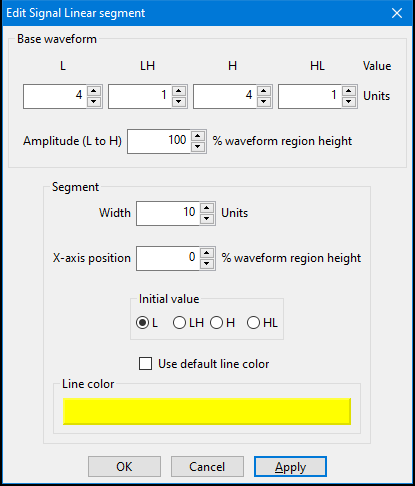
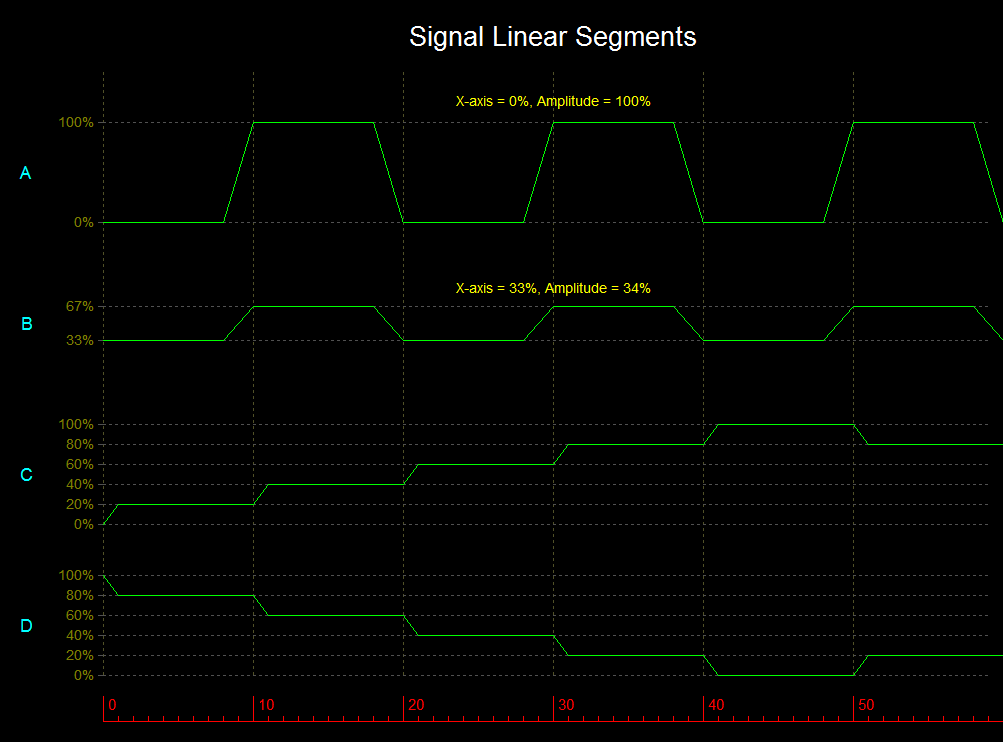
Menu: Segment | 2 Shortcut: 2 Base Waveform A Linear segment base waveform, is defined as containing: - 4 parts: Low level, Low-to-High transition, High level and High-to-Low transition. Each of these parts can be of 0 units, but not all of them. Thus, a base waveform is at least 1 unit wide. - Amplitude, which is the difference between Low and High levels within the waveform region, as a percentage of waveform region height. Segment A Linear segment is defined by its: - Widths in drawing units - X-axis position within the waveform region height. A Low level part is drawn along the X-axis, and a High level part is drawn Amplitude's height above it. It is not possible to set Amplitude + X-axis position > 100% of waveform region height, thus waveform saturation can never occur. - Initial value is the first of the 4 parts to be drawn. The 4 parts are then drawn in a cyclic repeated order. E.g.: If the initial value is L, the 4-part order is: L, LH, H, HL, and then repeat L, LH, H, HL, ... If the initial value is LH, the 4-part order is: LH, H, HL, L and then repeat LH, H, HL, L, ... |
|
|
|
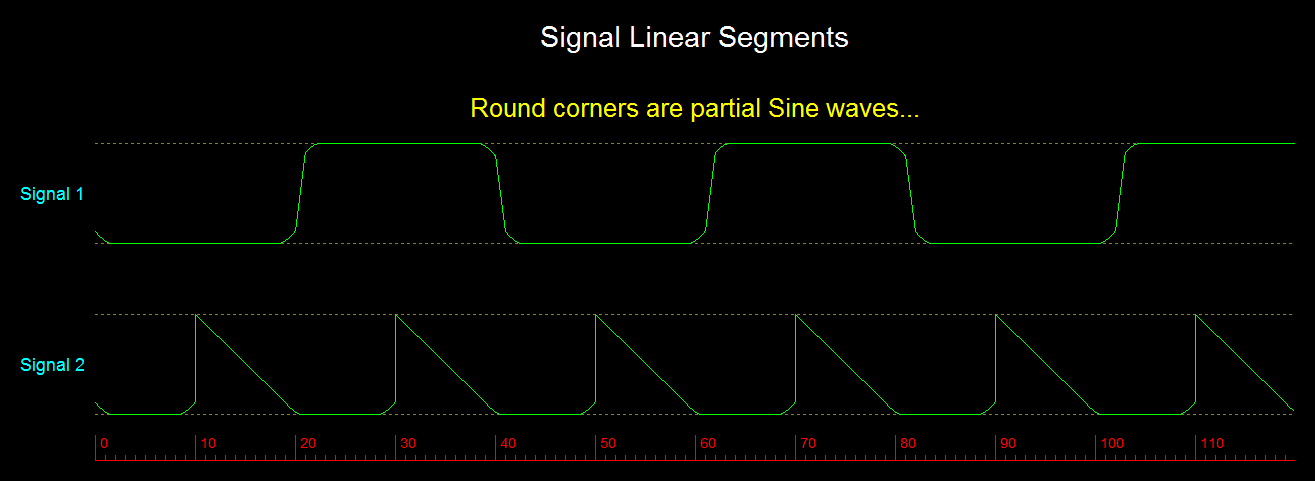
Ramp/RC Segment
|
Add a new Ramp/RC segment to a Signal waveform
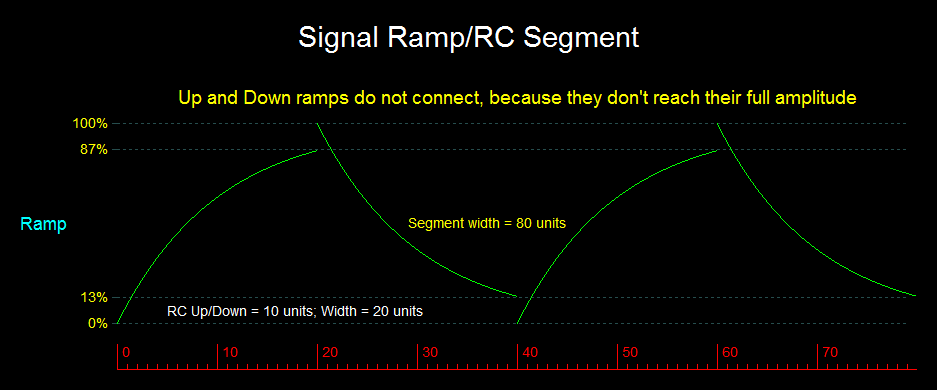
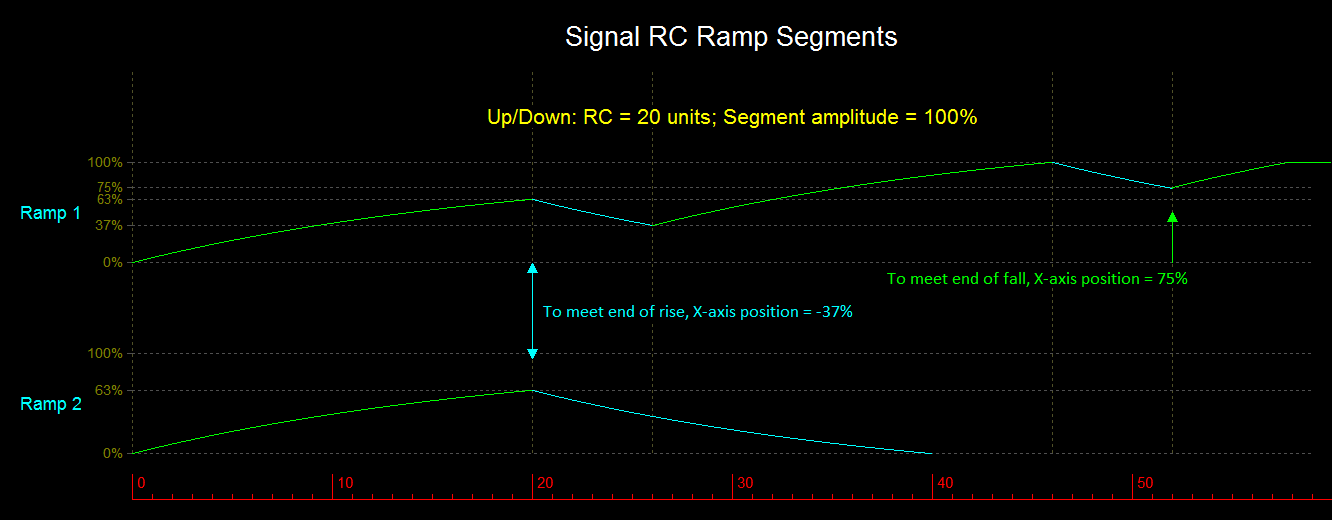
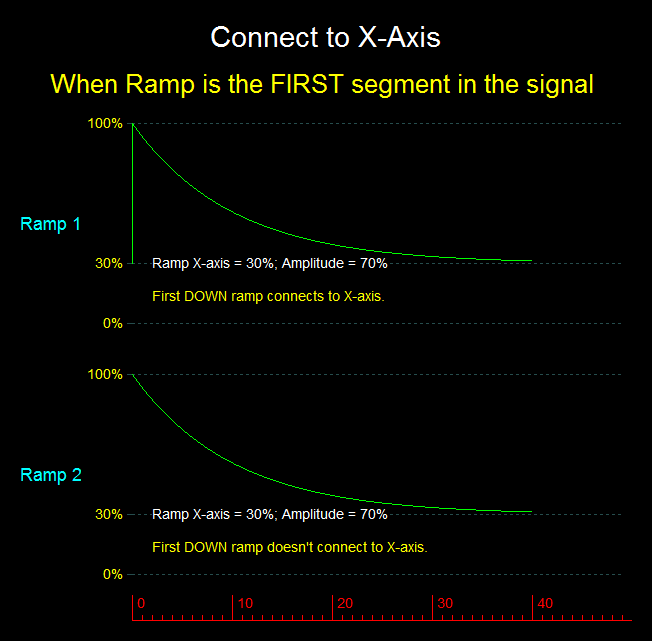
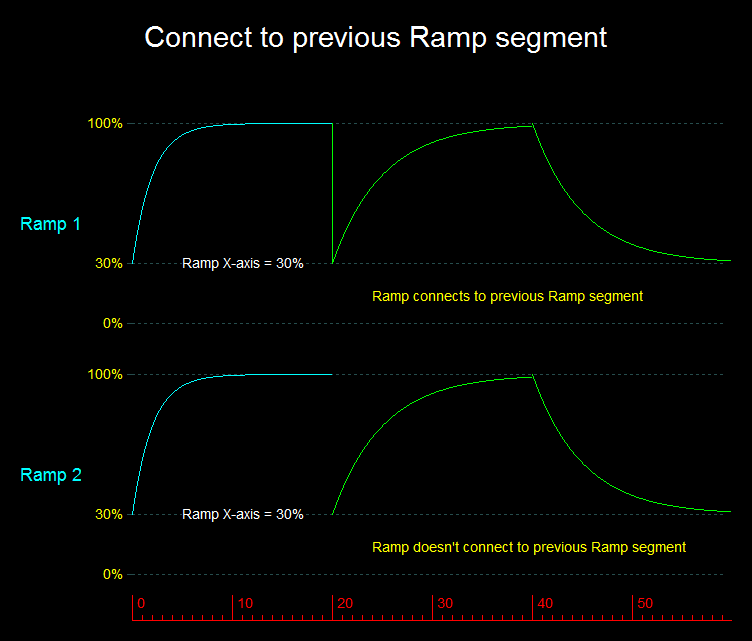
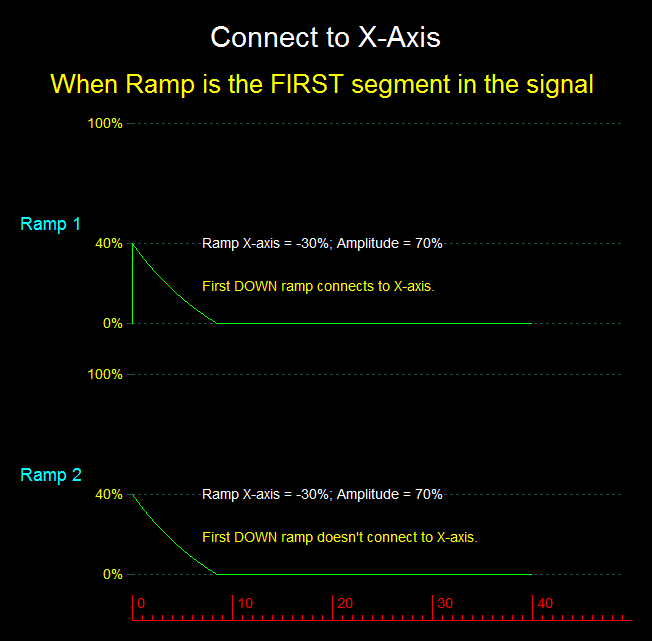
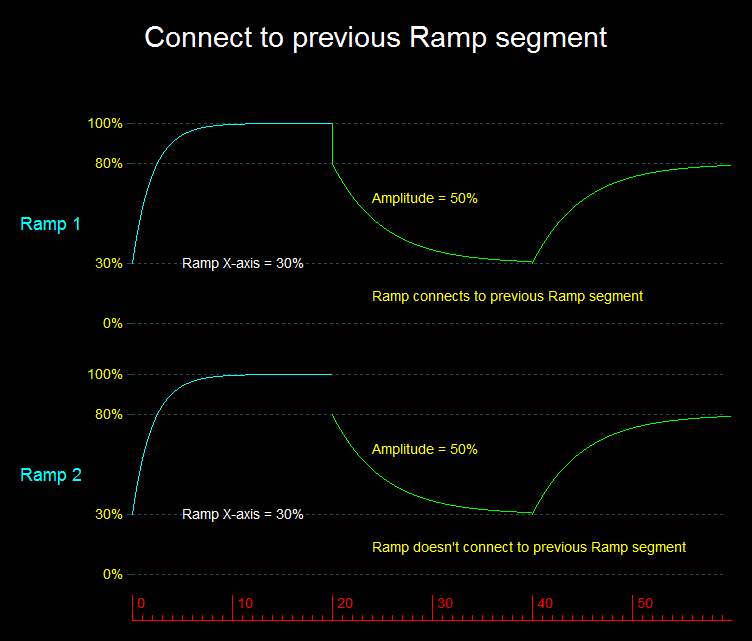
Menu: Segment | 3 Shortcut: 3 Base Waveform A Ramp/RC Base waveform, is defined as containing 2 parts, Up and Down ramps, drawn one after the other, with an RC time constant and a duration (width) per ramp part. The max. rise and fall is given by Amplitude. The Up ramp always starts from X-axis (y=0), and rises up to Amplitude height above the X-axis. The Down ramp always starts at Amplitude height above the X-axis, and falls toward the X-axis. It is possible for the waveform to saturate, either at the top or bottom of the waveform region. If a ramp's width is too short for its waveform to reach its steady-state value, the following ramp part in the segment will not connect to it vertically. Segment A Ramp segment is defined by: - Width in drawing units. - X-axis position within the waveform region. X-axis can be negative, placing it below the row's waveform region, but a waveform is never drawn outside of that region. This is a useful feature when you want to create a smooth transition between the end of one Ramp segment and the start of another Ramp segment. See example below. - Select how the segment starts, with either Up or Down ramp. Afterward, they will be drawn in a cyclic repeated order until the end of the segment. E.g. starting with Down part, the parts are drawn as: Down, Up, Down, Up, Down, ... - If this segment is the first in the Signal, and if the first ramp part in the segment is Down, you have the option of drawing a vertical line between X-axis and the start of the segment; Otherwise, if the segment follows another Ramp segment, that does not end where this segment begins, you have the option of drawing a vertical line connecting the two segments together. |
|
|
|
|
|
