
Getting Started
Just a few things to know about Waveme to get you started, and you can also watch this video.
Starting Waveme
You can start Waveme either by:
- double clicking on its icon, or
- on the command line: waveme.exe [my_diagram.xml]
Waveme will attempt to open the most recently opened diagram file, unless you provide a specific diagram file name on the command line.
Waveme saves the names of the last 9 diagram files you worked on in a file named waveme_recent_diagrams.txt, so that you can quickly reopen any of them with the menu "File | Open recent..." .
waveme_recent_diagrams.txt is located in the same directory as Waveme's executable file.
Working with Waveme
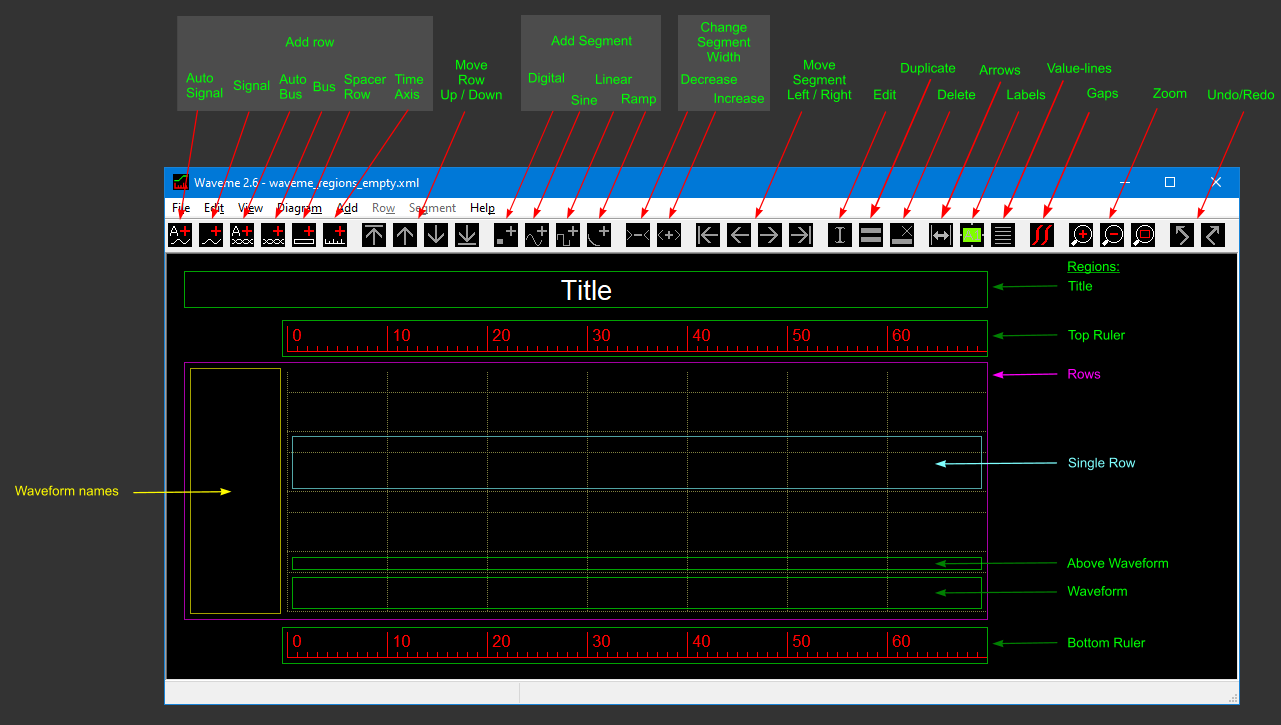
The drawing area in Waveme is divided into 4 vertical regions:
Title, top ruler, rows, and bottom ruler.
All regions are optional, which means:
- If the title text is left empty, a title will not be shown nor take any space;
- Of the two identical rulers, top and bottom, the user selects whether to show any, either or both of them; and
- If no rows are added, none are shown nor take any space.
Waveforms are drawn along horizontal drawing units.
A ruler defines the number of drawing units in a diagram, and the number of pixels in each drawing unit, both of which can be changed at any time. Thus, the ruler's width is the width of the longest waveform that can be drawn.
One or more rows can be added to the rows region. Each row can either hold a single waveform, be left empty (Spacer-row) or show a time axis.
Waveme supports the drawing of 4 types of waveforms: Signal, Auto-signal, Bus and Auto-bus.
A single row region contains two vertical sub-regions: "above waveform" and "waveform".
A waveform region is where a waveform is shown.
An above waveform region separates adjacent waveforms, which is also a convenient place for showing arrows and labels.
Select a row by left-clicking on its name, or press s and use the Up/Down arrow keys. A selected row has its name surrounded by a dashed rectangle. For convenience, left-clicking within the "waveform" area of an Auto-bus, Auto-signal, Time axis or Spacer row, also selects the row.
In Signal and Bus waveforms,
- Select a waveform segment, by left-clicking on it, or select a row, and then use the Right/Left arrow keys to select a segment. A selected segment is drawn with dashed lines.
- Select multiple consecutive segments, by selecting the first segment as above, then hold down the Ctrl key, and either left-click on the last segment, or use the Right/Left arrow keys to select additional segments.
You can't select an individual segment in Auto-signal or Auto-bus waveforms, since they are a repeated pattern.
Once a row is selected, use the Row menu, toolbar icons or keyboard shortcuts to interact with it (e.g. edit it).
Once a segment is selected, use the Segment menu, toolbar icons or keyboard shortcuts to interact with it.
Deselect a segment or row by pressing the Esc key, or left-clicking outside of it. When a segment is deselected, its row gets selected instead. One more Esc, and the row is deselected too.
You can always add another row, by using the Add menu, toolbar icons or keyboard shortcuts. If a row is selected, the new row will be added just below the selected one, otherwise the new row will be added below all other rows.
Arrows, labels and value-lines can be added to each row. To add or manage them, first select the row they belong to, and then use the Row menu, toolbar icons or keyboard shortcuts to work with them.
Gaps (breaks) in waveforms can be inserted at any drawing unit. Gaps affect all waveforms, thus they are a property of the diagram, and not of any individual row. Gaps are not shown in Spacer-rows.
As you draw, you can turn horizontal and/or vertical grid lines on or off.
Default and non-default option values
The appearance of each item is controlled by a set of options. When you create a new item, those options are set to their initial values. E.g. the initial apperance of an arrow is set with the Arrow Options dialog, which determines an arrow's line color, line pattern, etc. You can change many of the initial values to fit your needs and taste, and then ask Waveme to store them in a special file, so that future diagrams will also use the new values (see Diagram Defaults).
As you work with Waveme, you'll notice that some option values are marked as defaults while others are not (they are non-defaults).
Once you created an object, you can change its option value only if that value is defined as default value.
A non-default value can not be adjusted on a per-item basis, but rather is the only value for all objects using that option. For example, "Space above waveform" applies to all rows in a diagram, and you can not adjust that spacing for individual rows.
With some objects, e.g. row names, you can select that options link their values to their default values, so that when you change default values, your objects will change too. This makes it easy to change the appearance of multiple objects all at once, e.g. to change the row name Font in all rows. Otherwise, if an object no longer links to its default value, the object will retain its unique appearance regardless of changes to the default value.
Drawing order
The various objects in a diagram are drawn in a specific order, potentially causing one to be drawn on top of another:
- Title
- Rulers
- Grid lines
- Value lines
- Rows (Waveforms, Spacer row and Time axis)
- Gaps
- Arrows
- Labels
Additional information
This page should have given you a good starting point for working with Waveme. For a specific topic, see the relevant User Manual page.
Starting Waveme
You can start Waveme either by:
- double clicking on its icon, or
- on the command line: waveme.exe [my_diagram.xml]
Waveme will attempt to open the most recently opened diagram file, unless you provide a specific diagram file name on the command line.
Waveme saves the names of the last 9 diagram files you worked on in a file named waveme_recent_diagrams.txt, so that you can quickly reopen any of them with the menu "File | Open recent..." .
waveme_recent_diagrams.txt is located in the same directory as Waveme's executable file.
Working with Waveme
The drawing area in Waveme is divided into 4 vertical regions:
Title, top ruler, rows, and bottom ruler.
All regions are optional, which means:
- If the title text is left empty, a title will not be shown nor take any space;
- Of the two identical rulers, top and bottom, the user selects whether to show any, either or both of them; and
- If no rows are added, none are shown nor take any space.
Waveforms are drawn along horizontal drawing units.
A ruler defines the number of drawing units in a diagram, and the number of pixels in each drawing unit, both of which can be changed at any time. Thus, the ruler's width is the width of the longest waveform that can be drawn.
One or more rows can be added to the rows region. Each row can either hold a single waveform, be left empty (Spacer-row) or show a time axis.
Waveme supports the drawing of 4 types of waveforms: Signal, Auto-signal, Bus and Auto-bus.
A single row region contains two vertical sub-regions: "above waveform" and "waveform".
A waveform region is where a waveform is shown.
An above waveform region separates adjacent waveforms, which is also a convenient place for showing arrows and labels.
Select a row by left-clicking on its name, or press s and use the Up/Down arrow keys. A selected row has its name surrounded by a dashed rectangle. For convenience, left-clicking within the "waveform" area of an Auto-bus, Auto-signal, Time axis or Spacer row, also selects the row.
In Signal and Bus waveforms,
- Select a waveform segment, by left-clicking on it, or select a row, and then use the Right/Left arrow keys to select a segment. A selected segment is drawn with dashed lines.
- Select multiple consecutive segments, by selecting the first segment as above, then hold down the Ctrl key, and either left-click on the last segment, or use the Right/Left arrow keys to select additional segments.
You can't select an individual segment in Auto-signal or Auto-bus waveforms, since they are a repeated pattern.
Once a row is selected, use the Row menu, toolbar icons or keyboard shortcuts to interact with it (e.g. edit it).
Once a segment is selected, use the Segment menu, toolbar icons or keyboard shortcuts to interact with it.
Deselect a segment or row by pressing the Esc key, or left-clicking outside of it. When a segment is deselected, its row gets selected instead. One more Esc, and the row is deselected too.
You can always add another row, by using the Add menu, toolbar icons or keyboard shortcuts. If a row is selected, the new row will be added just below the selected one, otherwise the new row will be added below all other rows.
Arrows, labels and value-lines can be added to each row. To add or manage them, first select the row they belong to, and then use the Row menu, toolbar icons or keyboard shortcuts to work with them.
Gaps (breaks) in waveforms can be inserted at any drawing unit. Gaps affect all waveforms, thus they are a property of the diagram, and not of any individual row. Gaps are not shown in Spacer-rows.
As you draw, you can turn horizontal and/or vertical grid lines on or off.
Default and non-default option values
The appearance of each item is controlled by a set of options. When you create a new item, those options are set to their initial values. E.g. the initial apperance of an arrow is set with the Arrow Options dialog, which determines an arrow's line color, line pattern, etc. You can change many of the initial values to fit your needs and taste, and then ask Waveme to store them in a special file, so that future diagrams will also use the new values (see Diagram Defaults).
As you work with Waveme, you'll notice that some option values are marked as defaults while others are not (they are non-defaults).
Once you created an object, you can change its option value only if that value is defined as default value.
A non-default value can not be adjusted on a per-item basis, but rather is the only value for all objects using that option. For example, "Space above waveform" applies to all rows in a diagram, and you can not adjust that spacing for individual rows.
With some objects, e.g. row names, you can select that options link their values to their default values, so that when you change default values, your objects will change too. This makes it easy to change the appearance of multiple objects all at once, e.g. to change the row name Font in all rows. Otherwise, if an object no longer links to its default value, the object will retain its unique appearance regardless of changes to the default value.
Drawing order
The various objects in a diagram are drawn in a specific order, potentially causing one to be drawn on top of another:
- Title
- Rulers
- Grid lines
- Value lines
- Rows (Waveforms, Spacer row and Time axis)
- Gaps
- Arrows
- Labels
Additional information
This page should have given you a good starting point for working with Waveme. For a specific topic, see the relevant User Manual page.
