
Ruler
|
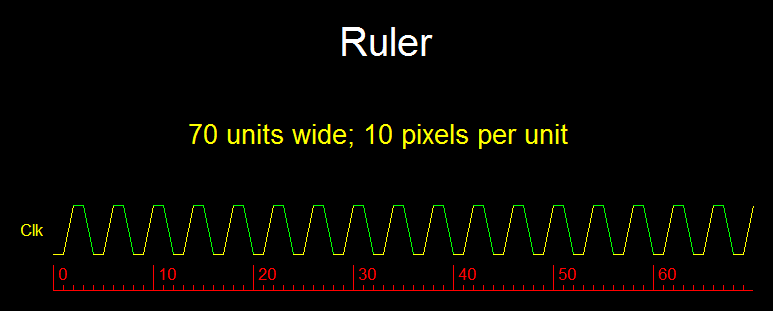
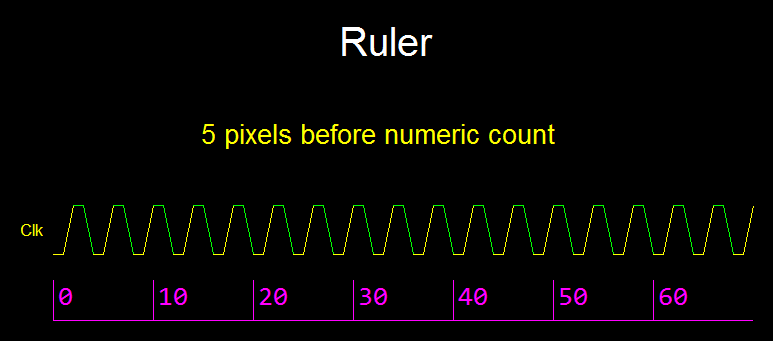
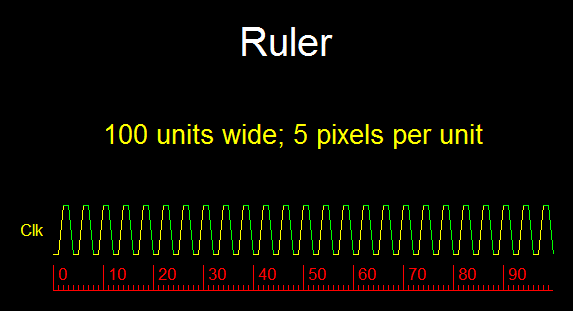
A ruler defines the number of drawing units, that a diagram contains, and the width of each unit in pixels.
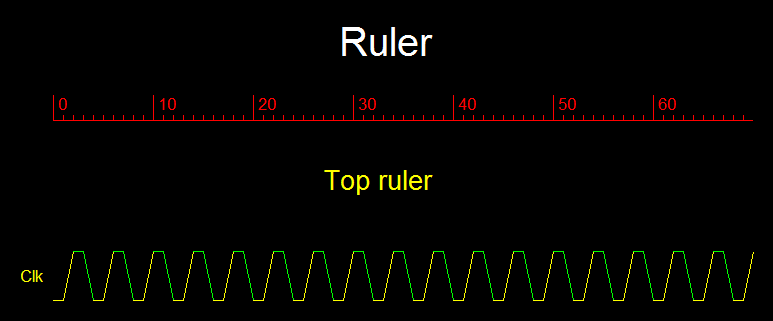
The number of units in a ruler is the maximum length of any waveform in the diagram. Menu: Diagram | Ruler Shortcut: r Show or hide ruler(s) with Menu: View | Show ruler Shortcut: Alt+R Whether and where a ruler is shown is under your control. You can select not to show the ruler, show it above all the waveforms (top ruler), below all the waveforms (bottom ruler), or both. Thus, you have the option of using the ruler while drawing, and then hiding it in the final diagram. Auto-signal and Auto-bus waveforms are drawn for you to the full extent of the ruler. Changing the ruler length will also change the total length of these waveforms. Signal and Bus waveforms are drawn by you, segment by segment, by specifying the number of units in each segment, until you have drawn along the entire ruler length. If you later realize you need to draw longer waveforms, just increase the number of units in the ruler, to gain more drawing space. Conversely, you can decrease the number of units in the ruler, but only if no Signal, Bus, Gap, Arrow, Value-line or Label uses those extra units. Other ruler features, that you can adjust:
|
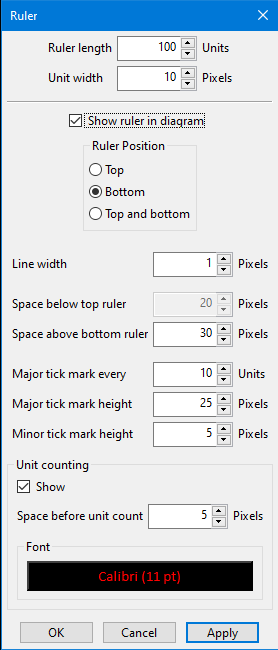
Ruler options dialog
|
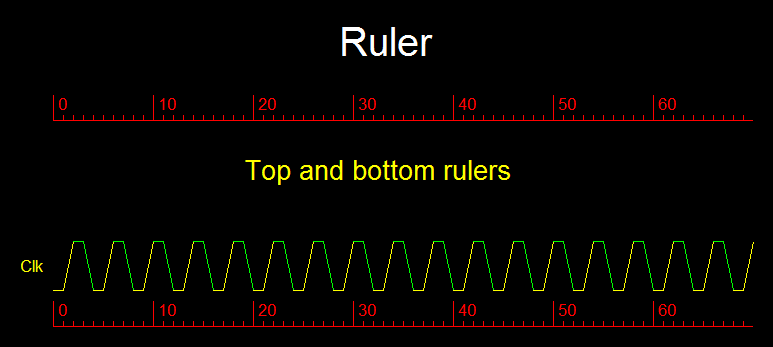
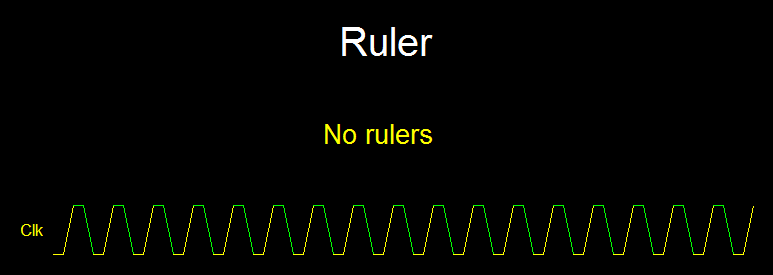
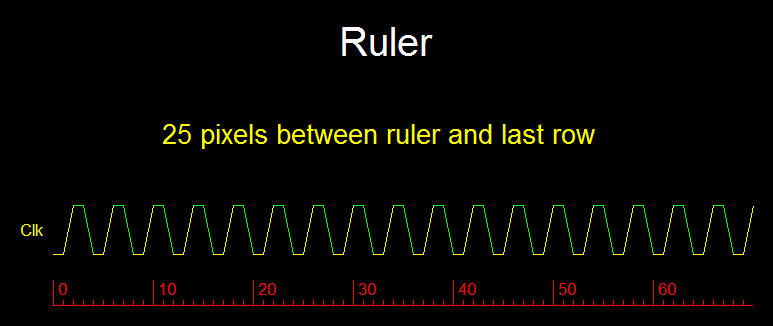
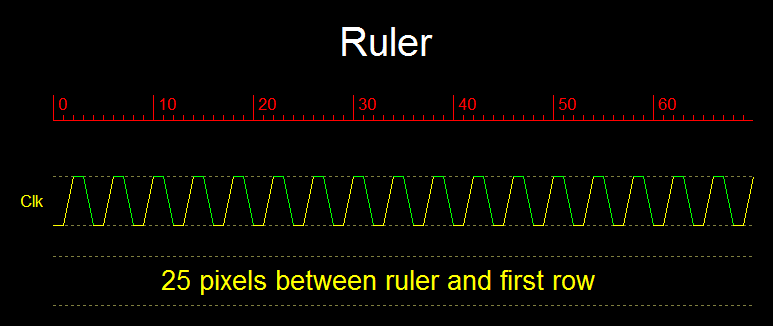
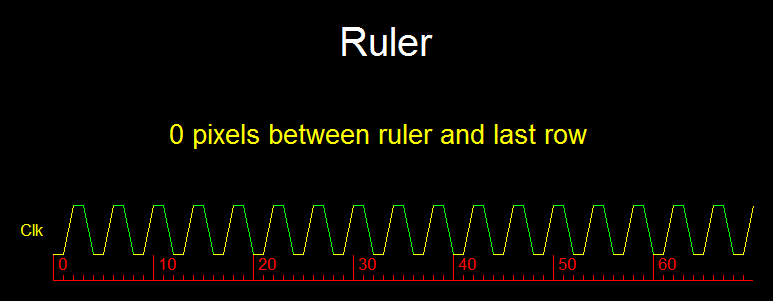
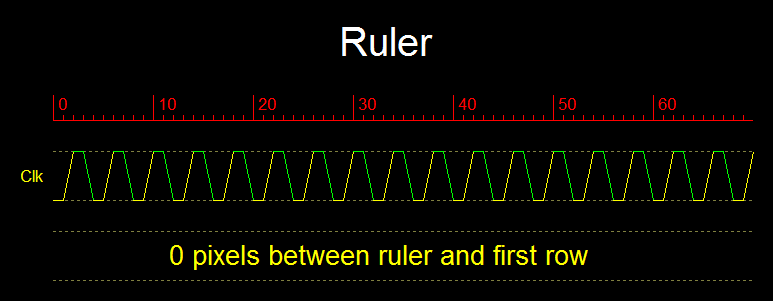
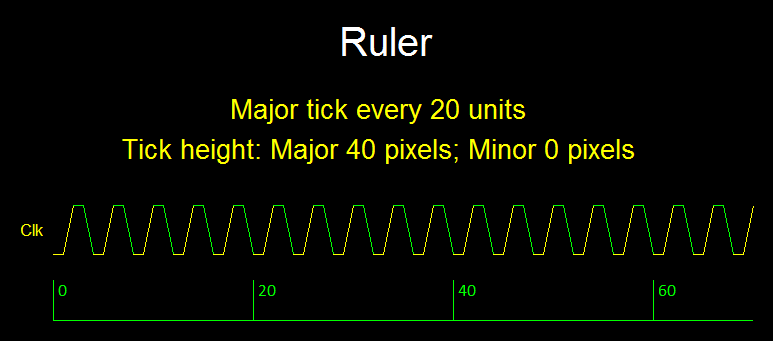
Ruler position (Top, Bottom, Top & Bottom, Not shown)
|

|
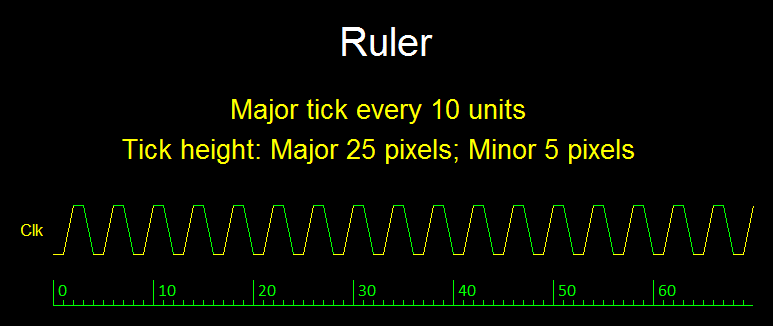
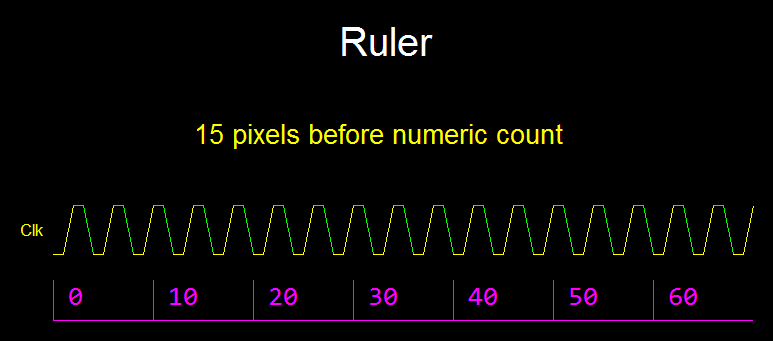
Ruler configurations (font, color, count, spacing)
|
|
